- California housing market sputters for third straight month in May
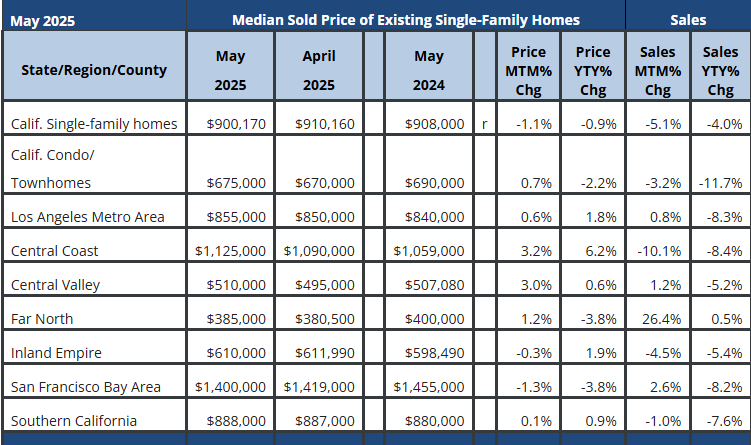
as home sales and prices pull back, C.A.R. reports - May’s statewide median home price was $900,170, down 1.1 percent from April and down 0.9 percent from $908,000 in May 2024.
- Year-to-date statewide home sales were up 0.3 percent.
SACRAMENTO (June 18) – California’s housing market continues to face headwinds as lingering tariff wars, ongoing economic uncertainty, and elevated mortgage interest rates undermined buyer confidence and dampened homebuyer demand in May, CALIFORNIA ASSOCIATION OF REALTORS® (C.A.R.) said today.
Infographic: https://www.car.org/Global/Infographics/2025-05-Sales-and-Price
Closed escrow sales of existing, single-family detached homes in California totaled a seasonally adjusted annualized rate of 254,190 in May, according to information collected by C.A.R. from more than 90 local REALTOR® associations and MLSs statewide. The statewide annualized sales figure represents what would be the total number of homes sold during 2025 if sales maintained the May pace throughout the year. It is adjusted to account for seasonal factors that typically influence home sales.
May’s sales pace fell 5.1 percent from the 267,710 homes sold in April and was down 4.0 percent from a year ago, when 264,850 homes were sold on an annualized basis. May’s sales level was the lowest in four months. The year-over-year decline was the largest since December 2023, and the monthly decline was the first in 17 months. Year-to-date sales barely exceeded the same timeframe in 2024 and could dip below last year’s level in June if the market continues to lose momentum.
Statewide pending sales in May slipped from last year’s level for the sixth consecutive month, but the year-over-year drop was the smallest in the past six months. With mortgage rates steadily increasing for three straight weeks since the beginning of May, mortgage demand softened further at the end of the month, despite rate improvements during the same time period. Housing sentiment, on the other hand, continued to rise, reaching the highest level in the past six months. Consumers who believed “now is a good time to buy” climbed to 26 percent in May ― the highest level since February 2022 ― from 23 percent in April. If this optimism continues to rise for another month while mortgage rates stabilize, the market momentum could pick up again to turn around the buying season.
“With home prices leveling off and more homes coming onto the market, it’s a great time for well-qualified buyers to enter the market,” said C.A.R. President Heather Ozur, a Palm Springs REALTOR®. “Lower prices are making homes more affordable, and the growing inventory means buyers have more choices. It’s a rare window where people can find their ideal home at a good value — making now an ideal time to buy.”
After recording a new high in April, the California median price pulled back in May but remained above the $900,000 benchmark. The May median price of $900,170 declined 1.1 percent from April and was down 0.9 percent from $908,000 in May 2024. The monthly decline was below the historical average of +1.2 percent recorded between April and May. The statewide median price decline can be attributed to multiple factors including elevated interest rates, insurance availability/affordability, economic uncertainty and home sellers’ willingness to reduce prices. Home prices will likely come down further from April’s record high as the market enters the second half of the year. Seasonality will play a role in the price moderation, and an increase in housing supply will also relieve upward price pressure.
“Although the market has slowed in recent months, there’s potential for a rebound if economic concerns subside,” said C.A.R. Senior Vice President and Chief Economist Jordan Levine. “Consumer sentiment appears to have bottomed out and is now showing signs of improvement, which could support a stronger housing market in the second half of the year. Buyers may take advantage of improved conditions, including deeper price reductions and increased housing inventory.”
Other key points from C.A.R.’s May 2025 resale housing report include:
-
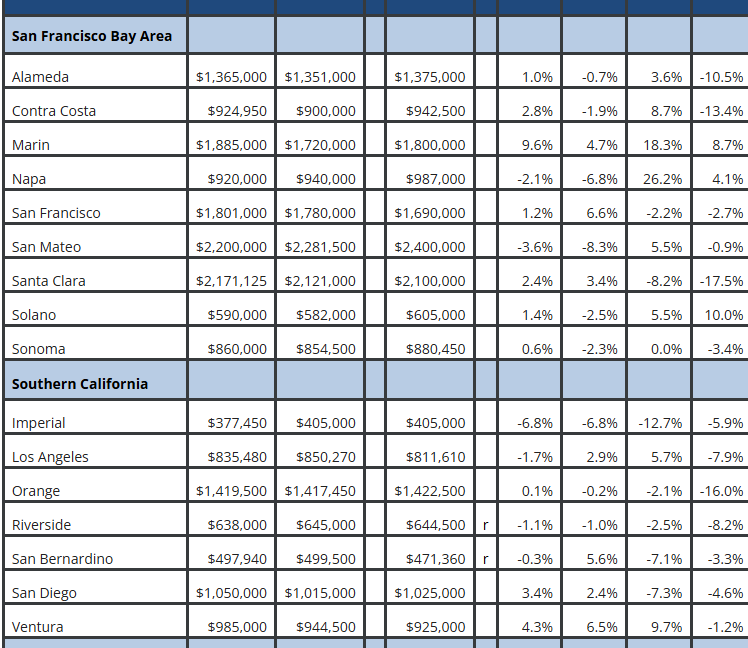
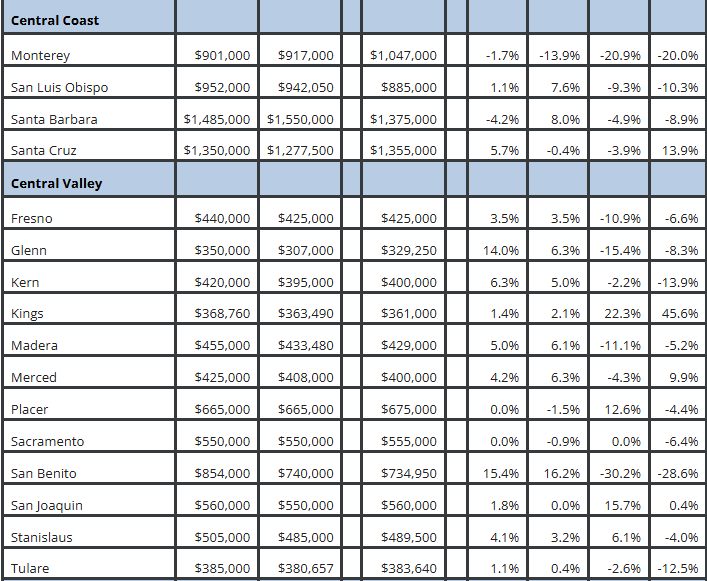
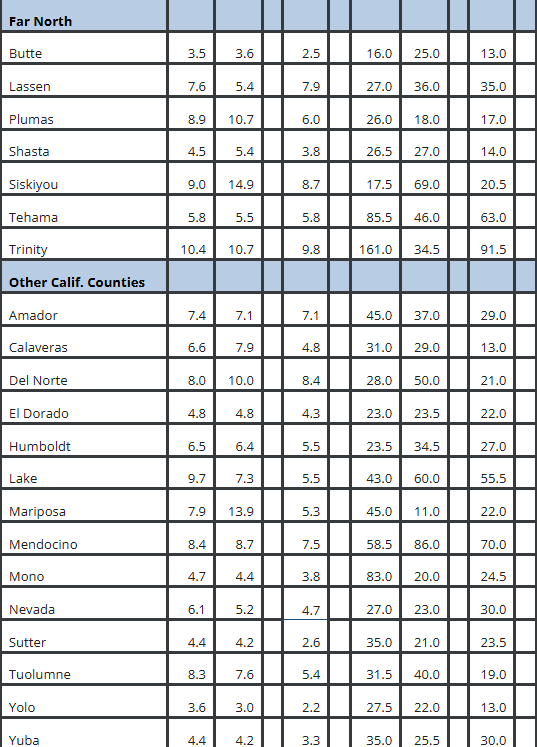
- At the regional level, unseasonally adjusted home sales in all but one major region in California recorded a sales decline in May as home purchase desire pulled back across the state. The Central Coast region experienced the biggest sales drop from last year with a decline of 8.4 percent, as three of its four counties recorded year-over-year losses. The San Francisco Bay Area followed closely behind with a drop of 8.2 percent, while sales in Southern California fell 7.6 percent and the Central Valley dipped 5.2 percent. The Far North region (0.5 percent) was the only region with a gain from last year, but the increase was essentially flat.
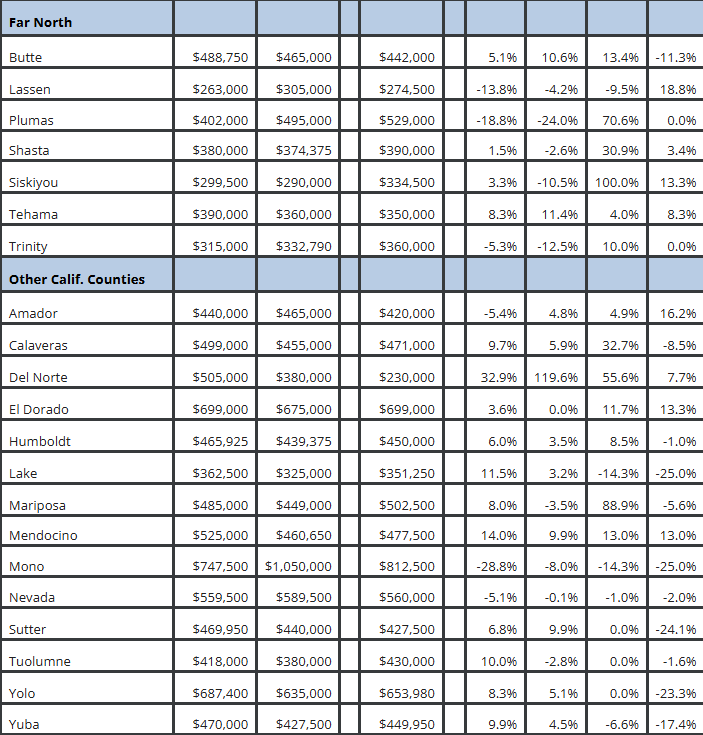
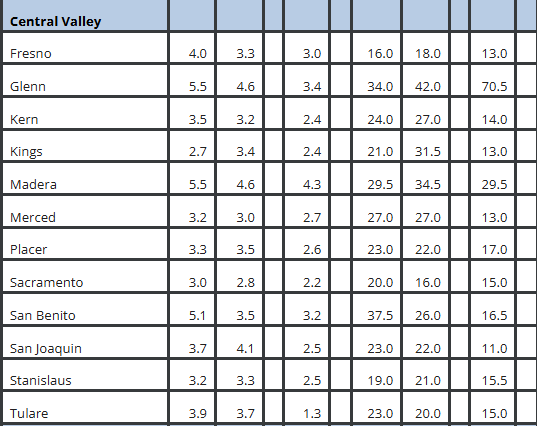
- Of the 53 counties tracked by C.A.R., 36 recorded a decline in home sales compared to a year ago, with about two-fifths of those experiencing drops of more than 10 percent. San Benito posted the sharpest year-over-year decrease at 28.6 percent, followed by Lake County at 25 percent, and Nevada County at 25 percent. Meanwhile, 15 counties saw an increase in home sales from a year earlier, with eight of them rising by more than 10 percent. Kings County led the gains with a 45.6 percent surge in May, followed by Plumas (18.8 percent) and Amador (16.2 percent).
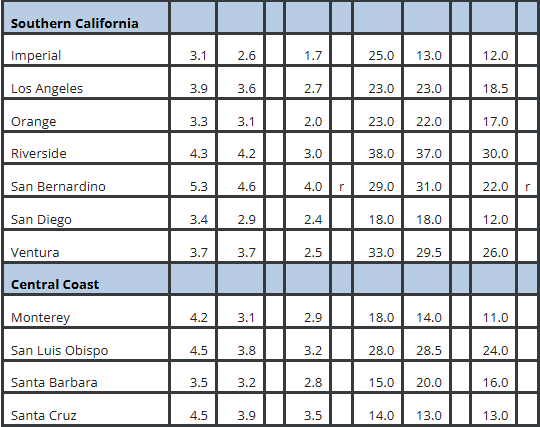
- At the regional level, three of California’s five major regions saw year-over-year increases in median home prices, though two of those gains were under 1 percent. The Central Coast led the state with a solid 6.2 percent increase compared to May 2024. Southern California (0.9 percent) and Central Valley (0.6 percent) also posted annual price gains, though both were modest — marking the second consecutive month with increases of less than 1 percent in each region. Meanwhile, the San Francisco Bay Area’s median price continued to decline, falling 3.8 percent, and the Far Northhad its first year-over-year decline in eight months at -3.8 percent.
- Home prices continued to rise year-over-year in many parts of California, with 29 of the 53 counties tracked by C.A.R. recording higher median sale prices in May compared to the same time last year. Del Norte County saw the largest increase, surging 119.6 percent, followed by San Benito (up 16.2 percent) and Tehama (up 11.4 percent). Meanwhile, 22 counties experienced a decline in median prices from May 2024. Plumas had the steepest drop at 24 percent, followed by Monterey (down 13.9 percent), Trinity (down 12.5 percent), and Siskiyou, which also posted a double-digit decline.
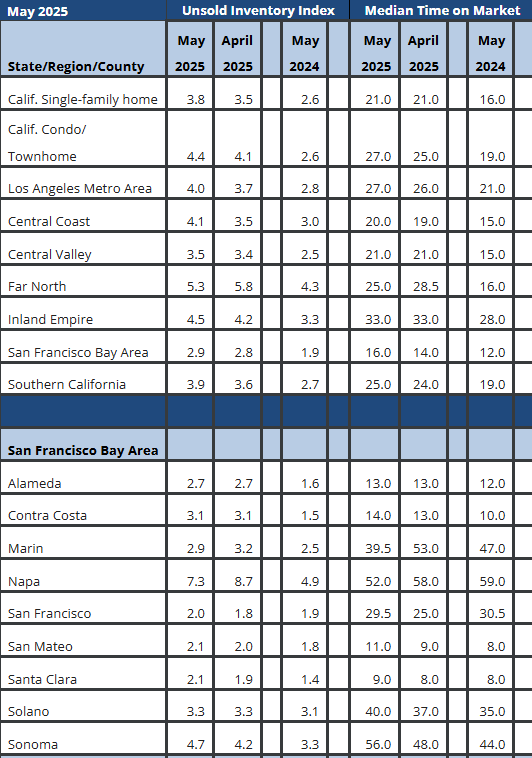
- May’s unsold inventory index (UII) climbed from the prior month as demand slowed while supply continued to grow. The UII measures the number of months needed to sell the supply of homes on the market at the current sales rate. The index was 3.8 months in May, up from 3.5 months in April and up from 2.6 months in May 2024. Total active listings in May rose on a year-over-year basis by nearly 50 percent and had been increasing at a double-digit growth rate for the last 15 months.The level of active listings last month reached a 67-month high and recorded its 16th consecutive month of annual gain in housing supply.
- New active listings at the state level jumped year-over-year by double-digits for the fifth straight month, as more properties continued to be listed onto the market. Newly added units continued to surge last month, growing 3.5 percent month-over-month and 22.8 percent year-over-year in May. Despite the increase from the prior month, the monthly gain in new active listings was the smallest April-to-May increase in the past four years. With the growth pace in new active listings slowing, housing supply may reach a plateau sometime in the next two months.
- The median number of days it took to sell a California single-family home was 21 days in May, up from 16 days in May 2024.
- C.A.R.’s statewide sales-price-to-list-price ratio* was 100 percent in May 2025 and 100 percent in May 2024.
- The statewide median price per square foot** for an existing single-family home was $443, down from $446 in May a year ago.
- The 30-year, fixed-mortgage interest rate averaged 6.82 percent in May, down from 7.06 percent in May 2024, according to C.A.R.’s calculations based on Freddie Mac’s weekly mortgage survey data.
Note: The County MLS median price and sales data in the tables are generated from a survey of more than 90 associations of REALTORS® throughout the state and represent statistics of existing single-family detached homes only. County sales data is not adjusted to account for seasonal factors that can influence home sales. Movements in sales prices should not be interpreted as changes in the cost of a standard home. The median price is where half sold for more and half sold for less; medians are more typical than average prices, which are skewed by a relatively small share of transactions at either the lower end or the upper end. Median prices can be influenced by changes in cost, as well as changes in the characteristics and the size of homes sold. The change in median prices should not be construed as actual price changes in specific homes.
*Sales-to-list-price ratio is an indicator that reflects the negotiation power of home buyers and home sellers under current market conditions. The ratio is calculated by dividing the final sales price of a property by its original list price and is expressed as a percentage. A sales-to-list ratio with 100 percent or above suggests that the property sold for more than the list price, and a ratio below 100 percent indicates that the price sold below the asking price.
**Price per square foot is a measure commonly used by real estate agents and brokers to determine how much a square foot of space a buyer will pay for a property. It is calculated as the sale price of the home divided by the number of finished square feet. C.A.R. currently tracks price-per-square foot statistics for 53 counties.
Leading the way…® in California real estate for 120 years, the CALIFORNIA ASSOCIATION OF REALTORS® (www.car.org) is one of the largest state trade organizations in the United States with 200,000 members dedicated to the advancement of professionalism in real estate. C.A.R. is headquartered in Sacramento.
(and condo sales data not seasonally adjusted)

r = revised
NA = not available
(Regional and condo sales data not seasonally adjusted)
r = revised
NA = not available
